 Rank: Senior Member Groups: Registered, Moderator
Joined: 4/14/2010(UTC)
Posts: 1,666
Was thanked: 16 time(s) in 16 post(s)
|
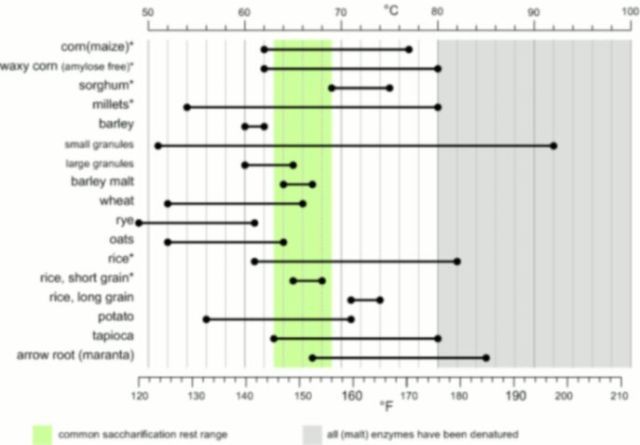
This is a chart that gives the specific temp ranges for the best utilization of starch in a given grain. It also depicts when denaturing of the enzymes of a certain grain will occur. If using a grain for malt then as you can see boiling will kill the enzymatic effect of the malt. 
|
|
|
|
|
|
 Rank: Senior Member Groups: Registered, Moderator
Joined: 4/14/2010(UTC)
Posts: 1,666
Was thanked: 16 time(s) in 16 post(s)
|
"  Ok guys I'm sure hopin this one is easier to read and deciphyer. For those that want allgrain to work at its best this may come in quite handy."
|
|
|
|
|
|
 Rank: Senior Member Groups: Registered, Moderator
Joined: 7/25/2009(UTC)
Posts: 2,209
|
it seems to re inforce the accepted infusion mash temp range of about 160 down to 140 deg F.
|
|
|
|
|
|
Rank: Guest
Groups: Guests
Joined: 2/10/2002(UTC)
Posts: 5,254
|
Thanks Sir. Very handy chart.
|
|
|
|
|
|
 Rank: Senior Member Groups: Registered
Joined: 1/27/2012(UTC)
Posts: 526
|
Thanks for the chart Heeler, I'm sure it will be used by many.
|
|
|
|
|
|
Forum Jump
You cannot post new topics in this forum.
You cannot reply to topics in this forum.
You cannot delete your posts in this forum.
You cannot edit your posts in this forum.
You cannot create polls in this forum.
You cannot vote in polls in this forum.

